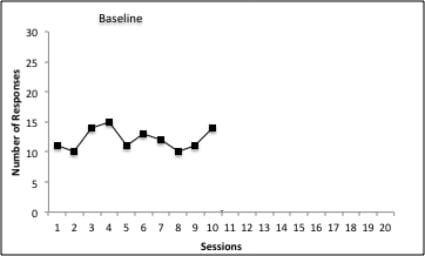
1.11 Measure Behavior During Baseline
Let’s look at a graph. This graph represents the number of times my cat scratches the couch. Remember that in baseline, I’m yelling at her every time she scratches the couch. This is what the data look like.
Basic Steps
Measure the behavior repeatedly in the baseline phase.
Implement the intervention and measure the behavior repeatedly in the intervention phase.
GRAPH the data and use VISUAL ANALYSIS to decide if the intervention caused a change in the behavior.
This section is for the civil and public discussion of the content of this page. We reserve the right to moderate and remove comments that are irrelevant, disrespectful, hateful, harassing, threatening, or spamlike. If you are experiencing a technical issue, please contact us for assistance.

