Better Outcomes Demand Better Graphing
Richard M. Kubina Jr.
Applied and basic researchers in behavior analysis rely on visual analysis of graphic data, a practice rooted in the field’s inception, yet concerns about its reliability have arisen, particularly in single-case designs. Critics argue for supplementing visual analysis with statistical methods to enhance objectivity and confidence in results, aiming to strengthen analytical and decision-making capabilities in the field. This presentation from the 2018 Michigan Autism Conference showcases studies highlighting weaknesses in graphing and strategies to bolster analytical rigor.
This product has been discontinued.
You may also like…
-
Interactive Video

1 BCBA CEU
The Scientist-Practitioner in Behavior Analysis: A Case Study
Murray Sidman4.50 out of 5(2)$9.99 Add to Cart Quick View -
Article Quiz

2 BCBA CEUs
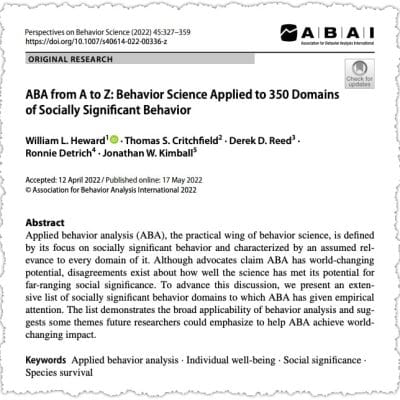
ABA from A to Z: Behavior Science Applied to 350 Domains of Socially Significant Behavior
William Heward, Thomas Critchfield, Derek Reed, Ronnie Detrich, & Jonathan Kimball5.00 out of 5(1)$19.99 Add to Cart Quick View -
Multimedia Tutorial

2 BCBA CEUs
Mastering the Basics of Visual Analysis
Katie Wolfe & Timothy A. Slocum4.31 out of 5(126)$19.99 Add to Cart Quick View


